


The pared-down, provincial-government-compiled Key Performance Indicators (KPIs) of “college quality” have been released by Colleges Ontario, and were presented to St. Clair’s Board of Governors during its March 26th meeting.
Pre-COVID, the annual KPIs used to involve a week-long surveying process in early-February, when students in every year of every program spent about 20 minutes at the start of a class to “grade” the college: how well the curriculum was preparing them for employment, how comfortable and up-to-date were the school’s facilities, and how helpful were campus services.
Both because that in-person surveying became impossible during the pandemic, and because the provincial Ministry of Colleges and Universities had started to look for other quality-evaluation methods, the current-student category of KPIs has been discontinued for several years.
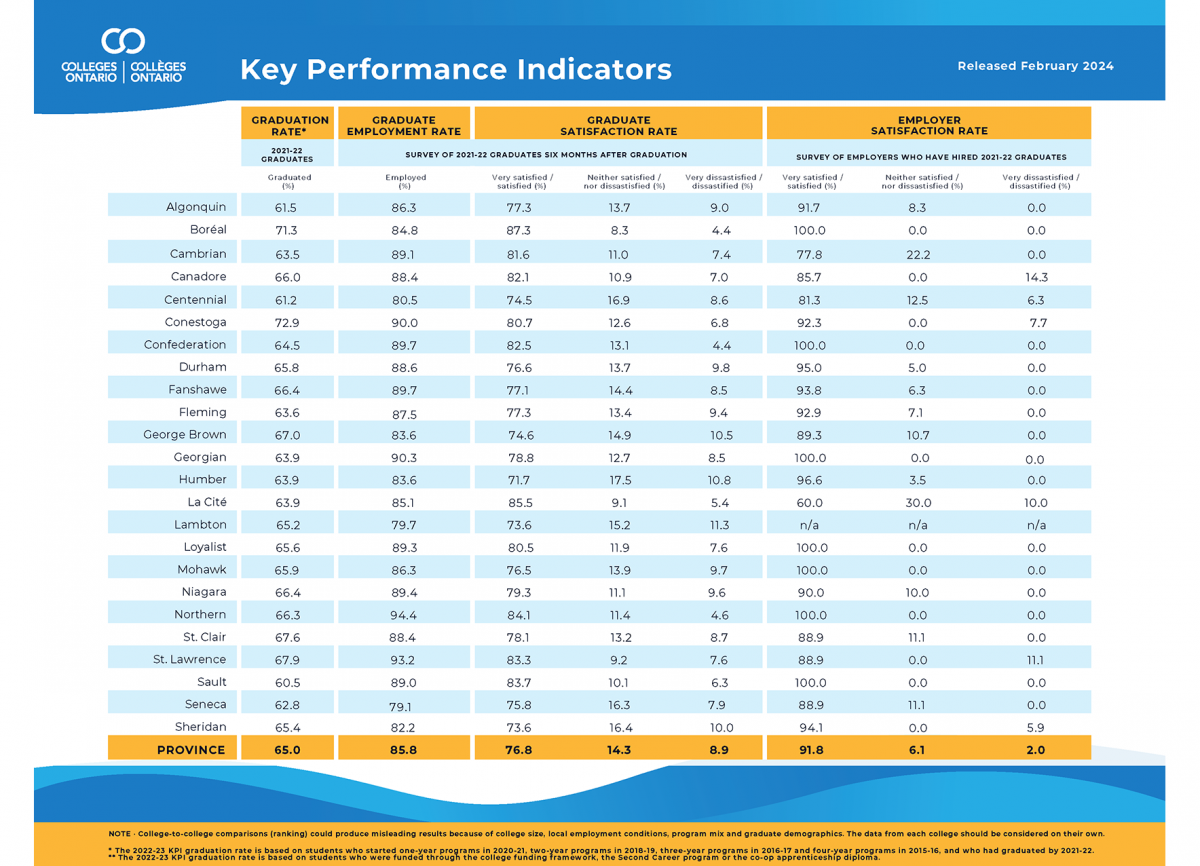
But still taking place are four KPI surveys associated with the graduates of Ontario’s two dozen public colleges:
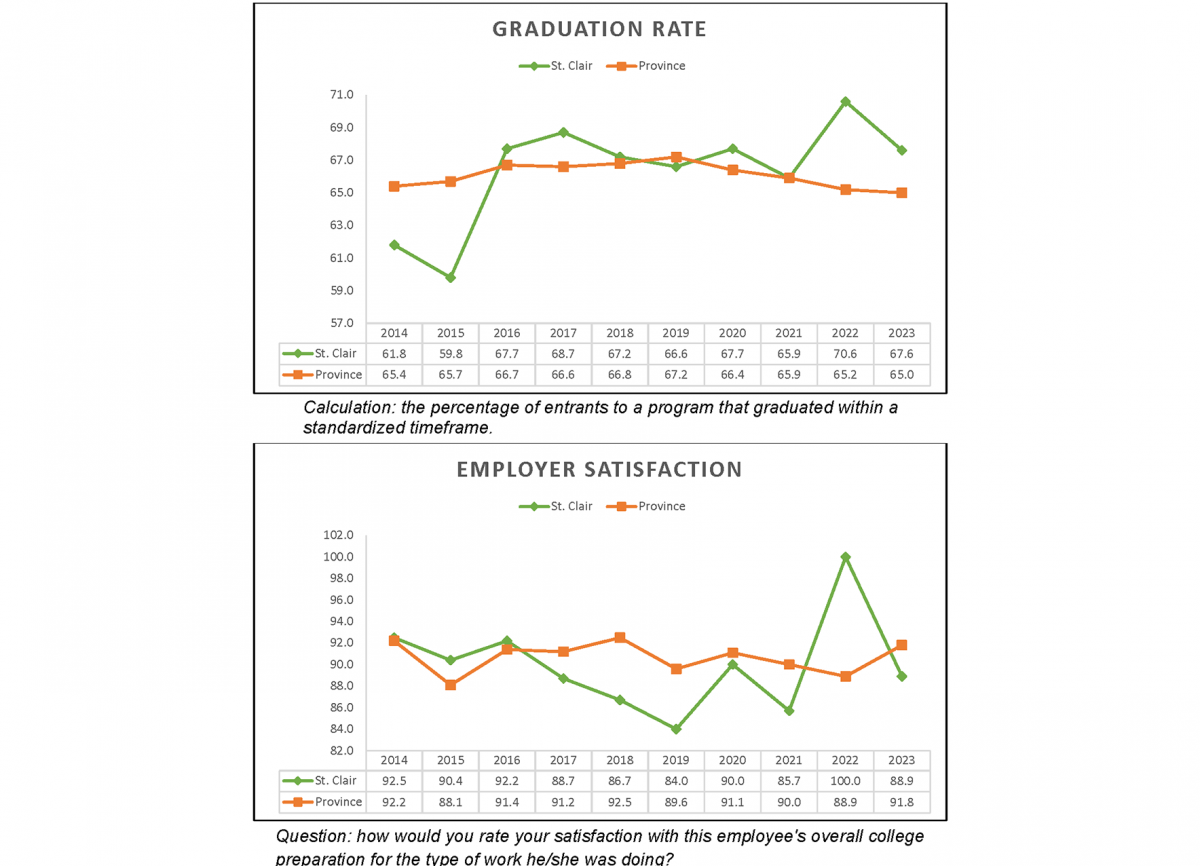
• the Graduation Rate (what percentage of students completed their educations from start to finish, without dropping/flunking out);
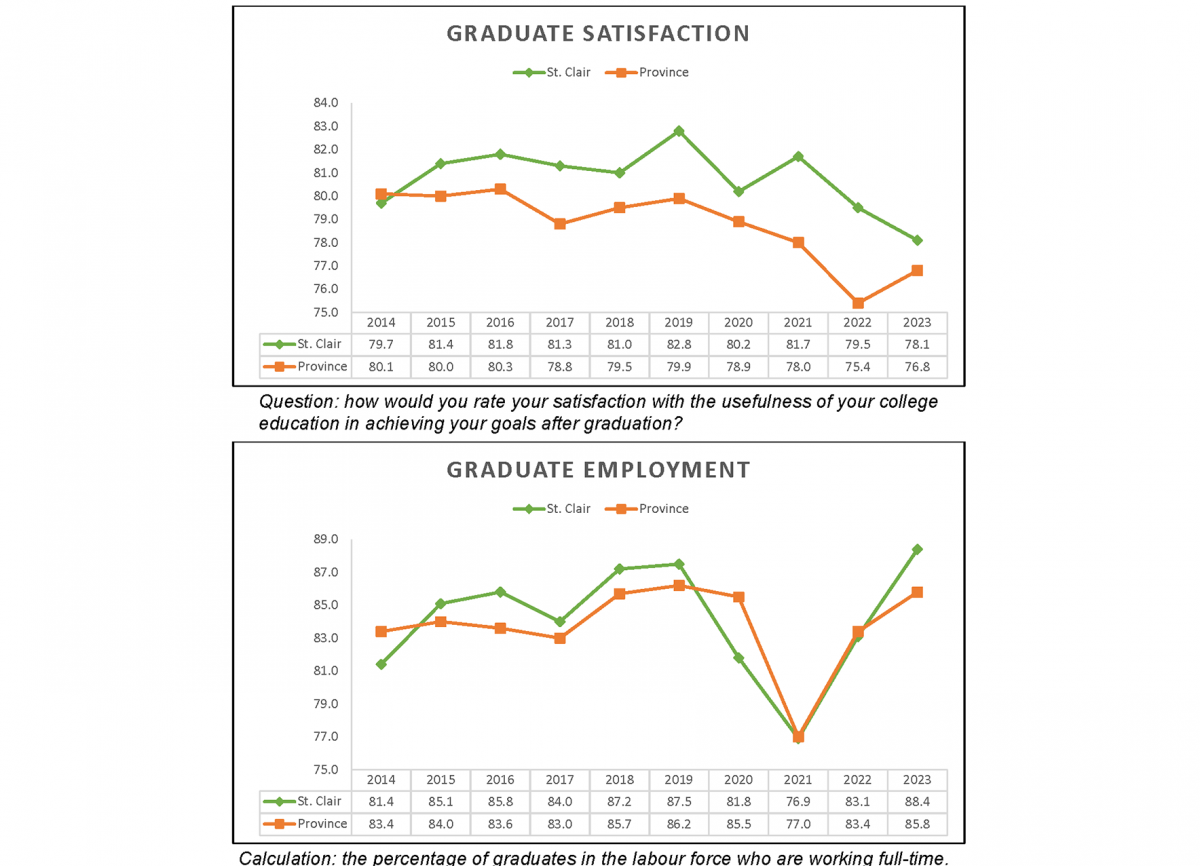
• the Graduate Employment Rate (how many grads found full-time jobs within six months of completing their studies);
• the Graduate Satisfaction Rate (in hindsight, did a graduate feel that his/her college actually provided a solid education and job-preparation); and
• the Employer Satisfaction Rate (are the companies and agencies that hired those recent grads happy with how the college system prepared them for the workforce).
The graphic above shows the comprehensive, results of the surveying of the 2021-22 graduating class of all of Ontario’s colleges. (It’s labelled as the 2022-23 report, but it actually deals with grads of the previous academic year.)
The one survey that has always been “skewed” to the point of irrelevance in the KPI system is that of Employer Satisfaction. During the phone interviews of recent grads, those individuals are asked to voluntarily give the survey company the contact information for their employers – and, also, give their permission for the surveyors to contact their new bosses. Many of the grads refuse to do that, because they don’t want their employers to be pestered. As a result, the sample size of surveyed employers can actually be quite small; and that, in turn, can severely skew the results. The “100 percent satisfaction rate” exhibited by some of the colleges in the province-wide graphic, for instance, may – and probably do – involve half-a-dozen or fewer bosses having been contacted.
Rather than comparing itself to other schools’ results (because a number of geo-/economic-demographic factors can make such comparisons misleading), St. Clair chiefly focuses on the year-to-year variations to its KPI results, and how they jive with the provincial average.
A snap-shot of those patterns appears in the graphs below, that were included in the report to the Board of Governors.
OTHER BOARD OF GOVERNORS STORIES:
The year in athletics: https://news.stclair-src.org/need-know-news/report-board-athletic-saints-were-spectacular-year
Enrolment will dip, but college still financial stable: https://news.stclair-src.org/need-know-news/2024-25-budget-despite-drop-international-enrolment-were-still-black


